RMagnolia is an R package that allows Magnolia ODE models (specified using the CSL simulation language) to be built, executed and scripted from within the R statistical computing environment. Magnolia works by using the rJava package to expose various components of the Magnolia application to R. The Magnolia translator and compiler, and the executable models created by Magnolia, are represented by R objects that can be manipulated using R statements. This allows the wide variety of data analysis and visualization features available in R to be applied to Magnolia ODE models.
Installation
The Magnolia package can be downloaded by visiting the Magnolia registration page here.
Magnolia requires that a 64-bit version of Java Development Kit (JDK) be installed and configured on your computer. Additionally, you’ll need the RTools addons, and the devtools and rJava packages. The general steps for installation are as follows:
- Install the 64-bit Java JDK; installers are available here. Set the JAVA_HOME environment variable to point to the installation directory for the JDK.
- Ensure that the 64-bit version of R is installed. Magnolia works exclusively with the 64-bit version of R.
- Download and install the Magnolia source package using the normal package installation mechanisms. IMPORTANT: because RMagnolia is exclusively a 64 bit package, you may need to use the following command to install it and avoid an error message:
|
1 |
install.packages("C:/path-to-rmagnolia-package/RMagnolia_1.3.15.zip", repos = NULL, type = "source", INSTALL_opts = c("--no-multiarch")) |
Note that binary distributions of R packages for macOS typically have a file extension of “.tgz”. If RMagnolia is being installed on R running on macOS, adjust the file name in the above command accordingly.
Usage
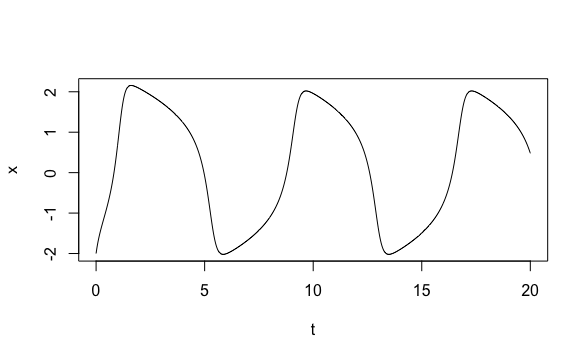
For usage details, see the “Build and Run a Model” vignette installed with the Magnolia package, which uses the Van der Pol oscillator model as an example. Briefly, the following code can be used to specify and build the Van Der Pol model code within R, run the model, and generate and R plot showing the resulting trajectories:
|
1 2 3 4 5 6 7 8 9 10 11 12 13 14 15 16 17 18 19 20 21 22 23 24 25 26 27 28 29 30 31 32 33 34 35 36 37 38 39 40 41 42 |
library(RMagnolia) code = "model VanderPol derivative cinterval cint = 0.01 constant xic = -2.0, xdic = 4.0 constant mu = 2.0 xdd = mu*(1 - x^2)*xd - x xd = integ(xdd, xdic) x = integ(xd, xic) constant tstop = 10.0 termt(t >= tstop, 'Stopped on time limit') end ! derivative end ! model" # Build the model mdl <- magnoliaBuild(code) # Indicate which model outputs will be logged mdl$prepare("t") mdl$prepare("x") mdl$prepare("xd") # Adjust the stopping time to 20.0 mdl$tstop <- 20 # Run the model mdl$run() # Get time histories of variables we want to plot t <- mdl$history("t") x <- mdl$history("x") xd <- mdl$history("xd") # Plot the trajectories plot(t, x, "l") plot(t, xd, "l") |
Running the above script generates the following plots: